Stay Updated
Join our mailing list to stay informed on how we're creating pathways to opportunity.
The Housing and Community Development Act of 1974, which created the first Tenant Based Rental Assistance program called the Housing Choice Voucher (HCV) program, had as one of its goals “the reduction of the isolation of income groups within communities and geographical areas and the promotion of an increase in the diversity and vitality of neighborhoods through the spatial deconcentration of housing opportunities for persons of lower income…”. Housing Choice Vouchers are tenant-based, portable subsidies that low-income families can use toward their rents in the private market. In order to be eligible, a family must be very low-income (50% or below area median income (AMI)), although 75% of all vouchers must be given to extremely low-income families (30% or below AMI). Households generally pay 30% of their income towards the rent, and the voucher covers the remaining portion. Since its introduction in the Nixon administration, the Act has created the Federal Government’s most significant tool to address a host of issues, including housing affordability, quality, and stability. However, more than five decades since, the Housing Choice Voucher program has yet to realize its full potential to truly unlock choice for the more than 2 million recipients.
A recent article in Cityscape journal’s “Fifty Years of Tenant-Based Rental Assistance” edition entitled “Location Patterns of Housing Choice Voucher Households Between 2010 and 2020,” evaluated the more recent years of the program in terms of the goal of spatial deconcentration. The article highlights the fact that concentration of voucher households has increased nationally in the decade between 2010 and 2020. However, the article reports that during that timeframe the greatest decrease in voucher concentration by metropolitan area occurred in the Baltimore-Columbia-Towson Metropolitan Statistical Area (MSA). This is a significant accomplishment for our region that stands in contrast to the national trend.
What has the Baltimore region done during this period to achieve voucher deconcentration and expand housing choice when so much of the country is experiencing greater concentration?
Operating since 2002 in the Baltimore region[1], the Baltimore Housing Mobility Program has played a pivotal role in this success. Following the final Settlement Agreement of the Thompson v. HUD lawsuit in 2012, the Baltimore Regional Housing Partnership was created to administer the program and lead a period of significant growth. In 2012, the program was serving just under 1,800 households, and by the start of 2019, that number ballooned to nearly 4,400 households.
BRHP’s program is explicitly designed to promote geographic mobility for households with voucher assistance, coupling rental assistance with pre-and post-move counseling support to empower moves to low-poverty neighborhoods deemed by the program to be “opportunity” areas, which are designated by analysis of statistical metrics like poverty rate, unemployment rate, median household income, and other quantifiable metrics demonstrating community, educational and career opportunities. While the Baltimore region enjoys some of the highest median household incomes in the country, significantly above the national average of $80,610, (average median incomes: $87,056 in Baltimore County, $141,159 in Howard County, $117,650 in Anne Arundel, $105,029 in Harford County and $114,974 in Carroll County), families with limited incomes searching for housing in the private market often cannot access these opportunities without the support of dedicated housing mobility efforts.
The success of BRHP participants in accessing these neighborhoods has had a direct impact on voucher concentration in the region and has made Baltimore an exemplar for unlocking the promise of the housing choice voucher to create pathways to economic opportunity that can lead to achievement of the American Dream.
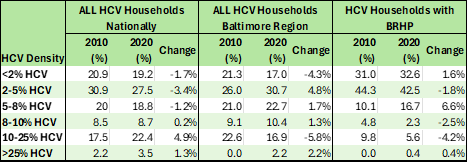
The article uses several methods for measuring voucher concentration. The first looks at the density of voucher in census tracts and measures a region’s distribution of voucher households relative to that density. The data show that nationally, there is a “trend toward an increasing share of voucher households living in HCV-dense areas.” As you will see in Figure 1, the Baltimore Region is generally consistent with this trend, however, the BRHP households in the region increased in the least dense neighborhoods, and overall BRHP households are far more likely to be in the least dense HCV neighborhoods, with fully three quarters of BRHP households living in neighborhoods with less than 5% HCV households.
The Herfindahl–Hirschman Index is a commonly accepted measure of market concentration2, most often used to measure the extent to which a particular firm has monopolized an industry. In this context, the HHI “was used to understand the magnitude to which TBV [Tenant-Based Voucher] households concentrated in a few neighborhoods…”; using such an index allows for a standardized measure that can be analyzed across time and metropolitan areas.
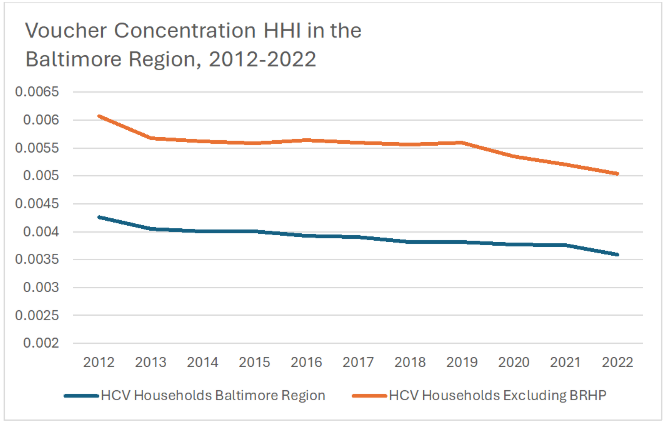
As previously mentioned, for the period from 2010 to 2020, the Baltimore region saw the largest decrease in voucher concentration as measured by the HHI across the nation.
Using 2012 as the baseline date for Figure 2 below, which coincides with period immediately before the significant growth of the BRHP program, the HHI score for all voucher households is 0.00426; however, excluding the BRHP households from the calculation the HHI is significantly higher, at 0.00607. Throughout the period of 2012-2022, BRHP voucher households had a significant effect on reducing voucher concentration as measured by HHI, accounting for a reduction of between 28-32%.
A persistent concern of policy makers and voucher administrators has been the poverty rate of neighborhoods where vouchers are used. While some gains were made in lower poverty neighborhoods in the decade from 2010 to 2020, a large portion of the HCV program remains concentrated in high poverty neighborhoods. In 2020, 44% of voucher households lived in high poverty neighborhoods with a 20% poverty rate or greater.
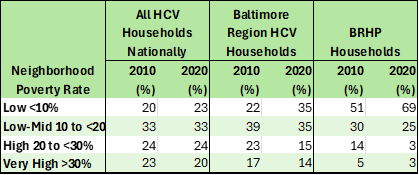
In Figure 3 below, the scale of the effectiveness of housing mobility programs comes clearly into view, showing how successful BRHP households are at accessing rental housing in low-poverty neighborhoods. While the Baltimore region’s voucher households closely followed the national poverty distribution in 2010, the growth of the BRHP program significantly improved the region’s numbers overall – going from only 22% in low-poverty neighborhoods in 2010 to 35% in those neighborhoods by 2020. In 2020, only 23% of all HCV households nationwide and 35% of HCV households in the Baltimore Region were in low poverty neighborhoods. Comparatively, in 2020, 69% of BRHP’s nearly 4,400 households resided in low-poverty neighborhoods with poverty rates less than 10%, and only 6% in neighborhoods with poverty over 20%.
Housing mobility programs have repeatedly been shown to have drastic, positive effects for families who participate, generating significant improvements in health and long-term financial outcomes. Beyond the individual benefits, robust housing mobility programs operating at scale can drastically reduce the voucher concentration of a region as participants gain access to rental properties in more communities with greater opportunities. Housing mobility can fulfill the promise of the Housing Choice Voucher Program, advancing economic and racial integration and serving as a powerful tool to reduce poverty concentration while expanding a renter’s choice.
Written by: Pete Cimbolic, Managing Director of Research and Innovation; Graham Bos, Data & Innovation Supervisor; Henry Podeschi, Data Analyst; Chandra Tamang, Data Analyst
1 The Baltimore region in the context of BRHP and the Baltimore Housing Mobility Program encompasses Baltimore City, and Anne Arundel, Baltimore, Carroll, Harford and Howard counties.